by Dr. Alicor Panao
Aside from a sense of duty and love of country, more Filipinos should vote on May 9, 2016. The reason is tied to the very essence of democracy.
Statistical analysis indicates that because there are only two effective candidates in local elections, non-voting will make one’s least preferred candidate win. Here are the details of my argument:
Elections are no doubt stressful for candidates and the Comelec, but such stress is healthy for our democracy. Democracy is often measured through the regularity of electoral exercises and the extent to which these exercises are competitive.
So what if one cannot vote? What has voting got to do with competitive elections? Let us consider what election data in 81 provinces in the Philippines from 1998 to 2013 tell us.
Let us assume that the proportion of people who did not, or were not able to vote, corresponds to the quotient when the difference between registered voters and actual voters is divided by total votes cast in the gubernatorial race. For simplicity, we allow this proportion ([registered voters – actual voters]/total voters) to represent crudely all those who by sheer pessimism did not choose to vote, as well as those who were disenfranchised by reasons such as, but not limited to, violence, intimidation, force, and fraud.
An election is presumably more competitive if there are more candidates competing effectively.[1] An effective candidate, in this case, is one who can mount a campaign credible enough to drive supporters to go to the polls (without necessarily winning it).
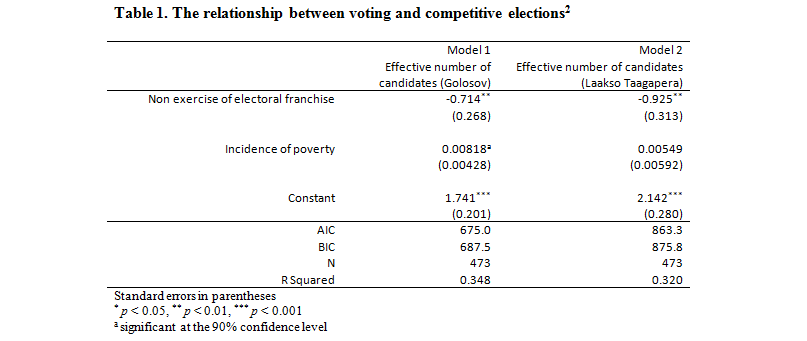
Table 1 summarizes the regression estimates showing the relationship between not voting and the competitiveness of elections. The estimates are based on a fixed effect model treating each gubernatorial election for all 81 provinces from 1998 to 2013 as panel. Here, poverty incidence is added as a crude proxy controlling for socioeconomic conditions. Politicians, after all, are known to exploit socioeconomic inequalities to mobilize or demobilize voters.
The estimates suggest the strong relationship between not voting and the competitiveness of the electoral exercise. This implies that elections become less competitive when people skip—or for some reason, were prevented from going to—the polls.
Table 1. The relationship between voting and competitive elections[2]
On average, one in three (33.7 percent) registered voters will not likely, or will never be able to vote. Overall voter turnout in the Philippines, however, is considered high. The national mean voter turnout for the Philippines from 1967 to 2013, according to the Institute for Democracy and Electoral Assistance (IDEA), is 78.49 percent. The first post-Marcos congressional election in 1987 saw the highest voter turnout at 90 percent. The national election during Arroyo’s succession presidency, on the other hand, had the most dismal (63.68 percent). The national figures, however, do not reflect the political exclusions that take place in the countryside.
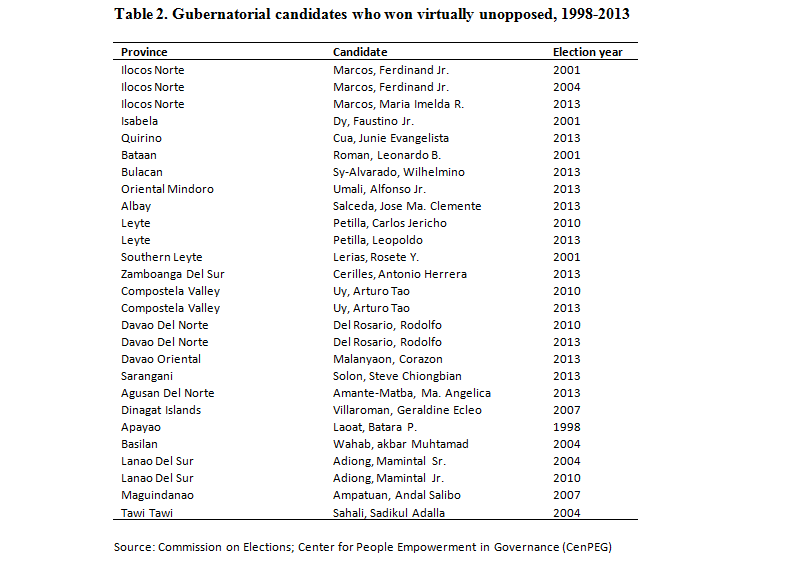
Curiously, for gubernatorial elections held between 1998 and 2013, the average number of effective candidates in the Philippines is only two. The provinces listed in Table 2 below had incumbents who competed for the gubernatorial seat virtually unopposed during these election years. Interestingly, most[3] of the unopposed, winning candidates in these provinces happen to have previously occupied the gubernatorial seat as incumbents or succeeded a relative.[4]
The fact that many of these candidates belong to well-entrenched political families is arguably incidental. We certainly do not intend to imply anything about competitive elections and political families. Furthermore, the estimates are crude and admittedly needs more refinements.
What is apparent is that it us voters who ultimately bear the brunt of our electoral choices, as well as the lack of it. In many instances, votes are not waived but robbed from the people using violence or fraud. For those who can exercise the right unhindered, the data hints that we are doing our least preferred candidate a favor whenever we waive our franchise.
In the absence
of quality candidates, some may be of the
impression it is better to boycott than choose between lesser evils. And that
may just be what the least preferred candidate wants.
[1] Adopting Golosov’s formula for computing effective number of parties, we can derive a similar index equal to Σ(pi/(pi + p12 – pi2)), where pi is the candidate’s vote share (votes received out of the total votes), p12 is the square of the share of the candidate with the highest vote, and pi2 is the square of each candidate’s vote share.
[2] Those interested to run their own estimates may request the dataset compiled by the Center for People Empowerment in Governance (CenPEG).
[3] Except for Saranggani in 2013, Dinagat Island in 2007, Apayao in 1998, and Tawi Tawi in 2004.
[4] A relative here is one who is related to the winning candidate by consanguinity or affinity up to the third degree.