by Erwin A. Alampay
The Philippines is a signatory to the Open Government initiative; one of the 8 original signatories. While Filipinos have long clamored for freedom of information, the government has complained that no one is using the data that they have made public.
So the objective of this column is to promote open government data use. The column is called OPEN SESAME, in that our articles make use of open data, and “sesame” to refer to the TV show that enabled many of my generation to learn the basics of reading, writing and counting. In other words, this column aims to promote the beginner’s appreciation of open data and a more open government.
This of course comes with a caveat, as the data that is open is, as yet, narrow and limited in scope and depth. Perhaps by using the data, government will be encouraged to make more of it accessible so that we can have better analytics.
This piece will focus on elections, and we make use of available data that is open in the COMELEC website. Perusing the data, two questions come to mind:
- How relevant is the NCR vote in the national elections?
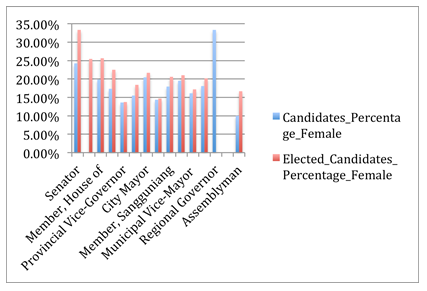
- What is the proportion of females who run for electoral positions, vis-‐à-‐vis the proportion who are elected?
The NCR Vote
Much of our
political and media life is
concentrated in Metro Manila. Hence,
much of the political ‘noise’ tends to reflect
Metro Manila issues. How does
this translate to actual votes during elections?
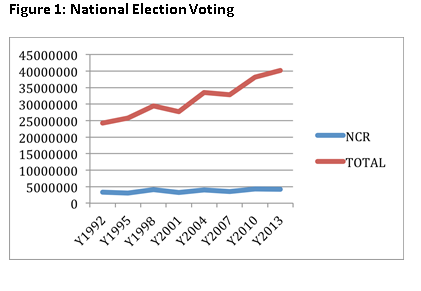
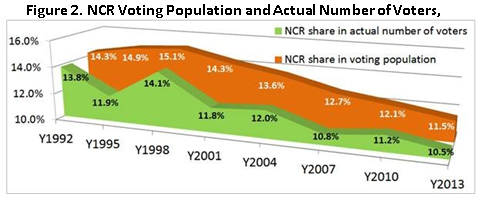
Figure 1 shows the actual number of votes cast over the last eight national elections. It illustrates that the proportion of
NCR votes cast has declined in proportion to the overall total. In the 1992 and 1998 elections, the proportion was approximately 14%. By 2010, this decreased to 11.2%, and in 2013, 10.5%. In other words, the impact of NCR on national election results has been in decline (see Figure 2).
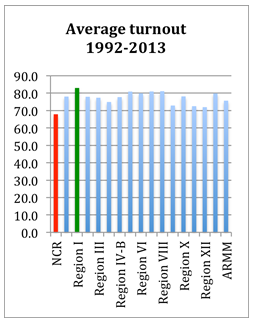
Consistent with this decline is the data showing that constituents in NCR are not voting as much as those in other regions. The average turnout in NCR in the past 8 years has only been 68%.
The next lowest turnout is region XII, at 72%. Contrast this with the Ilocanos in Region I who are 83% strong in their votes! (see Fig. 3)
Breaking the Glass Ceiling?
Why are there fewer females than males in elected posts? Are they less likely to win an election? Data from the COMELEC from the 2013 elections shown in Figure 4.